


A machine learning project that uses VGG16, AlexNet and t-SNE visualization to classify COVID-19 chest X-ray images.
1.1 Introduction
The coronavirus has become the most urgent problem facing humanity. This project aims to classify X-ray images. We will use constrained data sets to explore the feasibility and difficulty of building a system that can classify different phenomena in chest X-rays images.
1.2 The datasets
The data we will use has been collected by Adrian Xu, combining the Kaggle Chest X-ray dataset with the COVID-19 Chest X-ray dataset collected by Dr. Joseph Paul Cohen of the University of Montreal.
The datasets contain two separate parts, one for task 1 and the other for task 2. Each of them has been splitted into two parts, test and train. For task 1, each image is labeled by its causes: covid and normal. For task 2, each image is labeled by its causes: covid, normal, pneumonia bacteria, and pneumonia virus.
2 Task 1
2.1 Basic solution
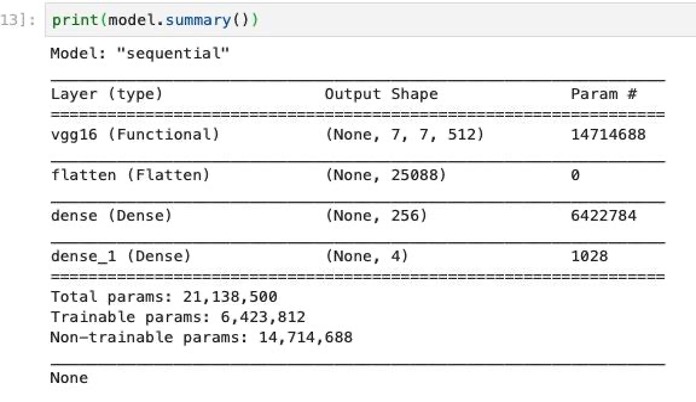
We start from taking a pre-trained model, VGG16 network, with weights obtained by training on Imagenet, and with the image size 224 x 224. We add a fully-connected layer with 256 neurons to allow processing on the entire image, and we use sigmoid function for binary classification with its confident value.
Optimizer: Adam
Loss function: binary cross-entropy
Learning rate: 0.0005
Batch size: 10
Number of Epochs: 40
Image size = 224 x 224
2.2 Architectures

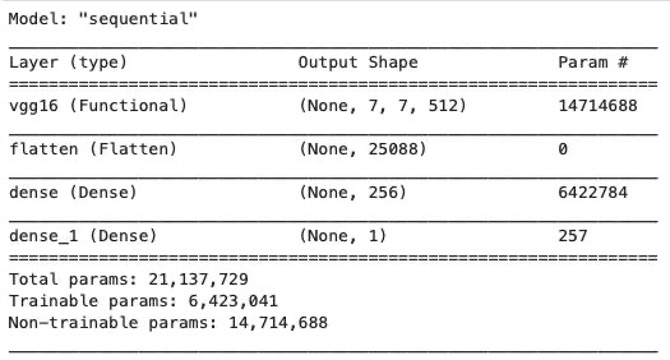
The architecture we utilize for task 1 is the VGG16 model, since it is very effective with image classification. We overall have three layers: a flatten layer, a fully-connected layer with 256 neurons with relu, and an activation function with sigmoid.
2.3 Optimizers and learning rate
For optimizers, we choose Adam optimizer. For the learning rate, we start off with a high rate first of 0.001 and experiment with reducing it gradually, and we eventually found 0.0005 is the most appropriate one for the optimal behaviors.
2.4 Loss function
Task 1 focuses on classifying the normal lung to those with COVID-19. For the loss function, we will use binary cross entropy, since the target is 0 or 1, which is binary classification.
2.5 Accuracy and Loss

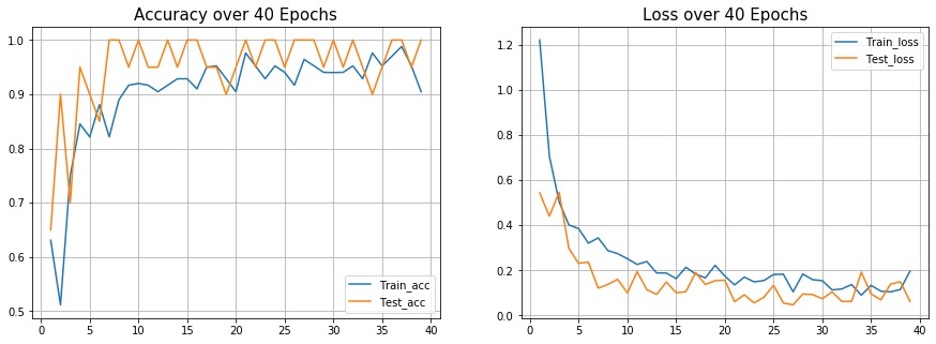
According to the accuracy plot, the test and train accuracy increases as the number of epoch increases, since each epoch means an entire dataset is passed forward and backward through the neural network, which will optimize each weights and parameters at each point, so that it can prevent overfitting and underfitting, which will increase overall accuracy of the model. In addition, At the point where the number of epochs roughly reaches 8, the test accuracy has already reached its maximum accuracy of 1, but the train accuracy is still growing in slow progress. This means we need more than 8 epochs to pass the training dataset multiple times in the same neural network. Overall, both train and test accuracy are close to 1, which indicates the model is not overfitting. Similarly, for the loss plot, the test and train loss decrease as the number of epochs increase. Overall, both train and test loss are close to 0, which indicates the model is not overfitting.
2.6 t-SNE visualization

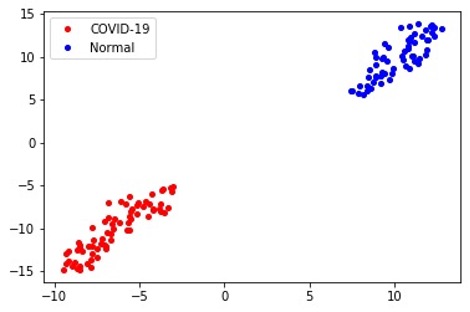
The red points are images of the X-ray of the lung with COVID-19, and the blue points are images of the X-ray of the normal lung. These two classes are well divided into two separate distinct compact clusters, which indicates this is a good classifier by the training of the VGG16 model.
2.7 GPU vs. CPU

We found CUDA Toolkit is not originally supported on the CSS platform , since we don’t have full access to the CSS computer platform, and we eventually end up running GPU using our own computer.

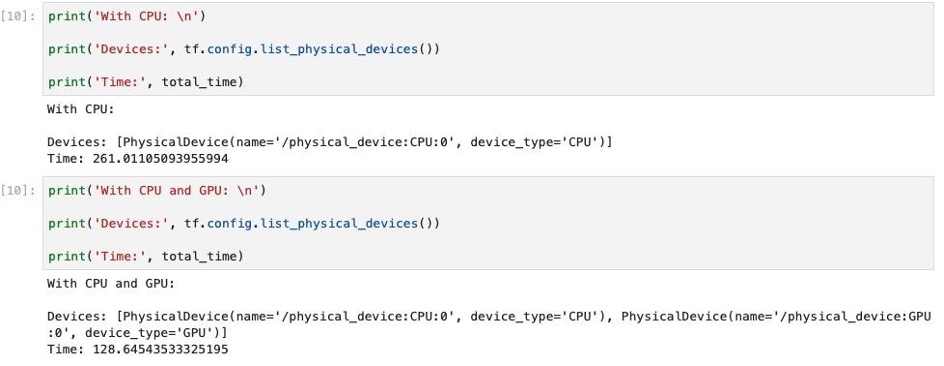
Training on CPU takes 261.011 seconds, whereas training on GPU takes only 128.645 seconds.
Clearly, from the graph above, we can tell that GPU can run much faster than CPU, since when processing deep neural networks, the multi-core parallel on GPU is much more efficient than CPU, which has much fewer cores.
3 Task 2
3.1 Basic solution
We start from taking a pre-trained model, VGG16 network, with weights obtained by training on Imagenet, and with the image size 224 x 224. We add a fully-connected layer with 256 neurons to allow processing on the entire image, attached with the softmax activation function, since this will allow us to give a probability output for each of the classes, and eventually get the maximum as our final predicted output.
Optimizer: Adam
Loss function: categorical cross-entropy
Learning rate: 0.0001
Batch size: 10
Number of Epochs: 100
Image size = 224 x 224
3.2 Architectures
3.2.1 VGG16:

The architecture we utilize for task 2 is the VGG16 model, since it is very effective with image classification. We overall have three layers: a flatten layer, a fully-connected layer with 256 neurons with relu, and an activation function with softmax.
3.2.2 AlexNet:

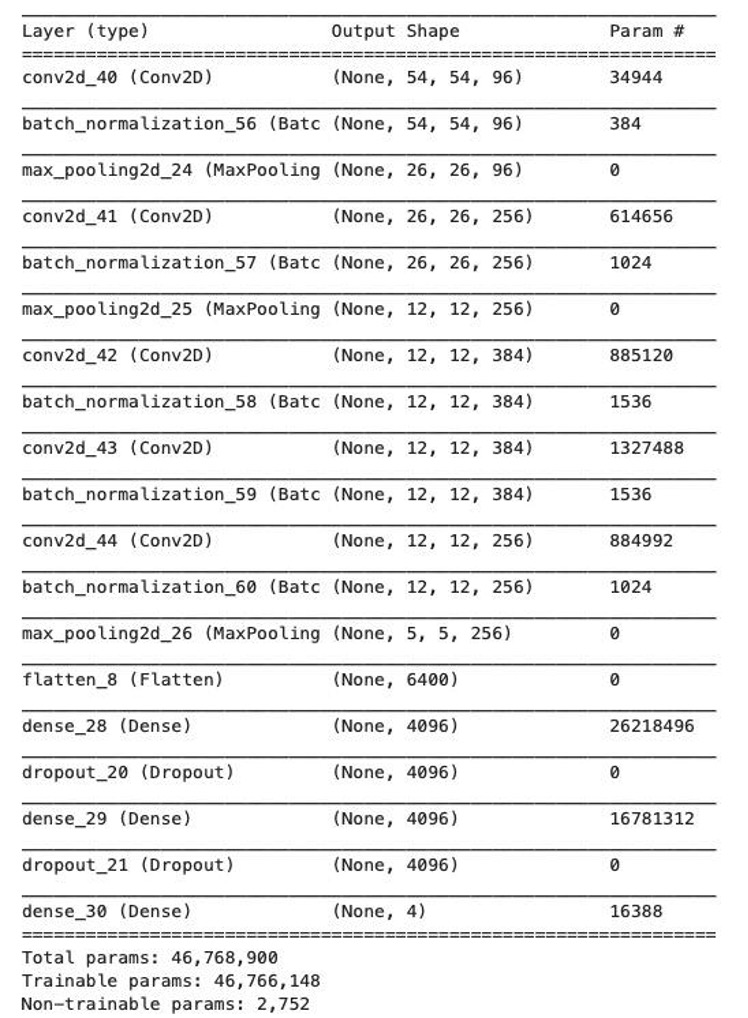
The advantage of using Alexnet is that it is a combination of multiple convolutional layers, combined with multiple pooling layers, normalizations, and fully-connected layers.
3.3 Optimizers and learning rate
For optimizers, we choose Adam optimizer. Again, we start off with a learning rate 0.001, and gradually reduce it, and eventually come up with 0.0001 to be the most appropriate one for loss decreasing.
3.4 Loss function
Task 2 focuses on classifying the normal lung to those with , COVID-19, Pneumonia-Bacterial, and Pneumonia-Viral. For the loss function, we will use categorical cross entropy, since this is a multi-class classification
3.5 Accuracy and Loss
3.5.1 AlexNet:
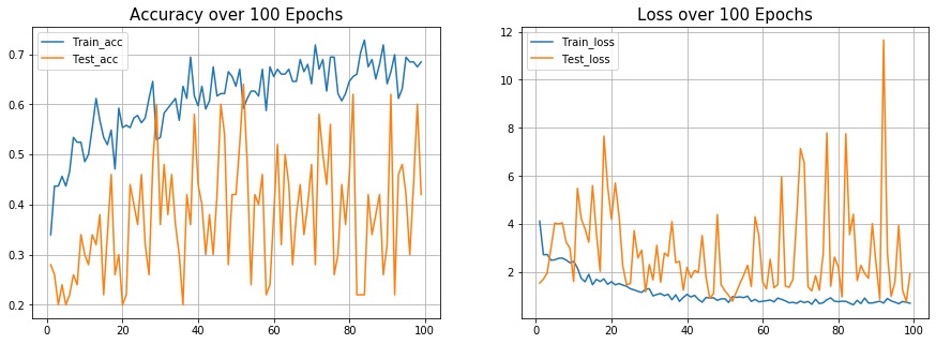
Both accuracy and loss plot are very unstable. Although there is an increasing pattern of training accuracy as the number of epochs goes up, the test accuracy shows no pattern, and it is overall lower than the training accuracy. Similarly, the loss plot shows a decreasing pattern of training loss as the number of epochs goes up, the test loss shows no pattern, and it is overall higher than the training loss. Therefore, this model could be overfitting or not an optimal solution.
3.5.2 VGG16:

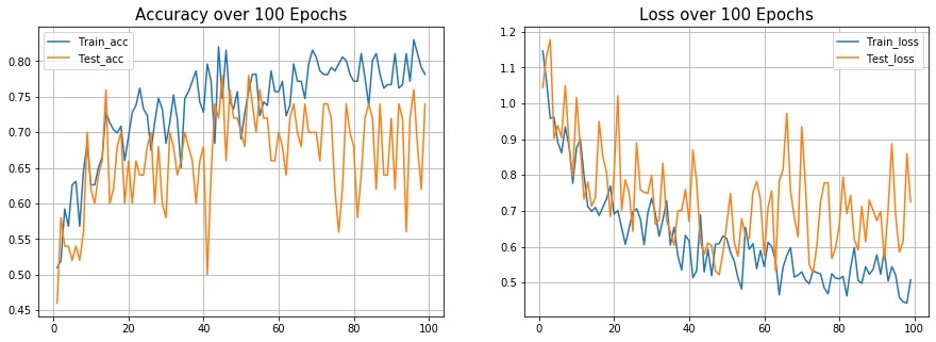
For the accuracy plot, both training accuracy and test accuracy are increasing as the number of epochs goes up. Similarly, both training loss and test loss are decreasing as the number of epochs goes up. Since both training accuracy and training loss are relatively close to the test accuracy and test loss, this model shows no evidence of overfitting.
3.6 Alexnet vs. VGG16
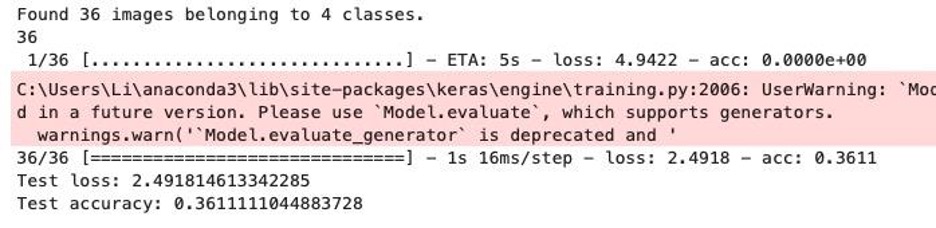
3.6.1 AlexNet:

3.6.2 VGG16:

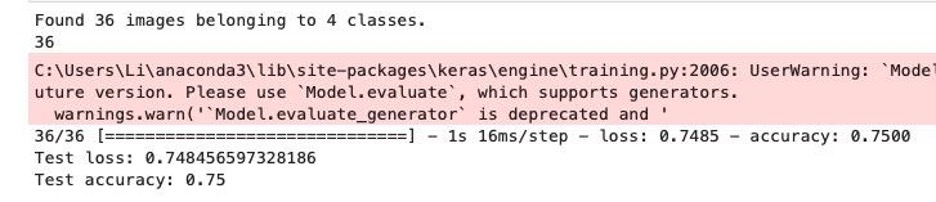
There is a huge difference between test accuracy of the two models. The VGG16 model has roughly 39 percent higher accuracy than Alexnet. According to the Accuracy and Loss plot of these two models. We can clearly see Alexnet could be overfitting and VGG16 is not. This is because we have a relatively small dataset, and Alexnet is more data-hungry than VGG16 since VGG16 is a pretrained model, which means it is already well trained with other large sizes of images. Therefore, when dealing with the training image, the AlexNet has to learn from ground up, while VGG16 has already been tuned to adopt images related training. Hence, better overall performance. Also, the small-size convolution filters allow VGG16 to have a large number of weight layers, and more layers leads to improved performance.
3.7 t-SNE visualization
3.7.1 VGG16:

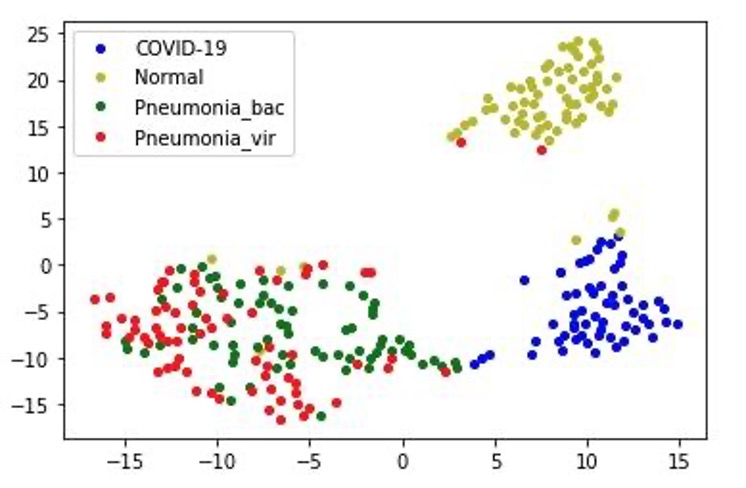
The blue points are images of the X-ray of the lung with COVID-19, the yellow points are images of the X-ray of the normal lungs, the green points are image of the X-ray of the lung with Pneumonia-bacterial, and the red points are image of the X-ray of the lung with Pneumonia-virus. These four classes are well divided into three separate distinct compact clusters, where the images of the X-ray of the normal lung are located in its yellow cluster, the images of the X-ray of the lung with COVID-19 are located in its blue cluster, and both the images of the X-ray of Pneumonia-bacterial and Pneumonia-virus are located in the red and green cluster, which indicates they are similar in terms of features and hard to distinct by the algorithm.
3.7.2 AlexNet:

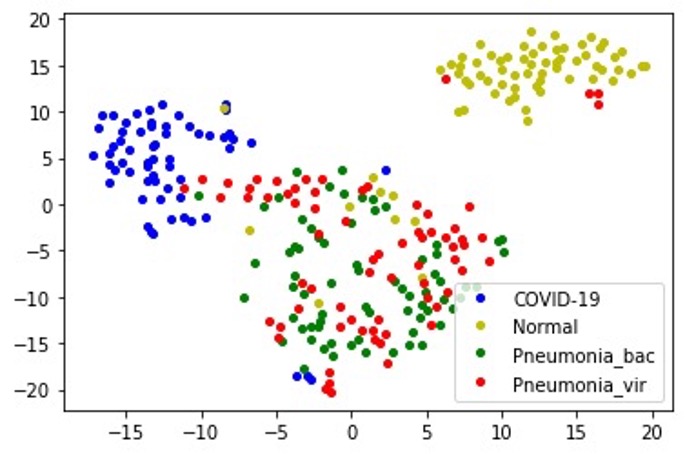
The blue points are images of the X-ray of the lung with COVID-19, the yellow points are images of the X-ray of the normal lungs, the green points are image of the X-ray of the lung with Pneumonia-bacterial, and the red points are image of the X-ray of the lung with Pneumonia-virus. These four classes are not as well classified as using the VGG16 model. Although there is a clear yellow compact cluster representing the images of the X-ray of the normal lungs on the right corner, the blue cluster representing the images of the X-ray of the lung with COVID-19 kind of mixes with the red and green clusters. However, it still shows a distinct compact cluster between blue with red and green clusters, and both the images of the X-ray of Pneumonia-bacterial and Pneumonia-virus are mixed in the red and green cluster, which again indicates they are similar in terms of features or the model is not that good.